Data featured in the BIS Data Portal are structured as time series, which are collections of time-ordered values. Time series are grouped in data sets, which are in turn organised in topics.
Find the data
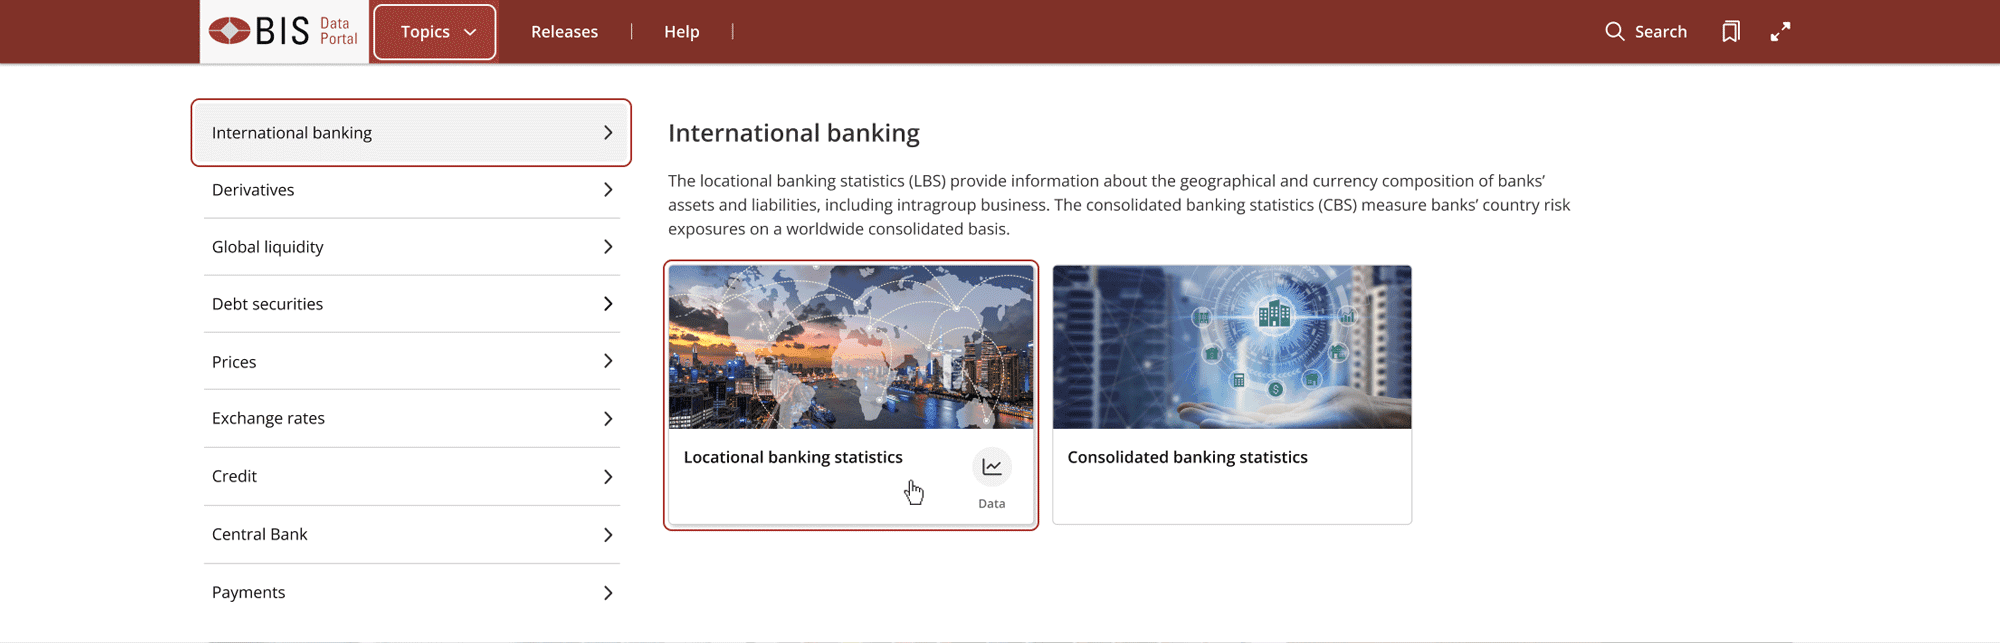
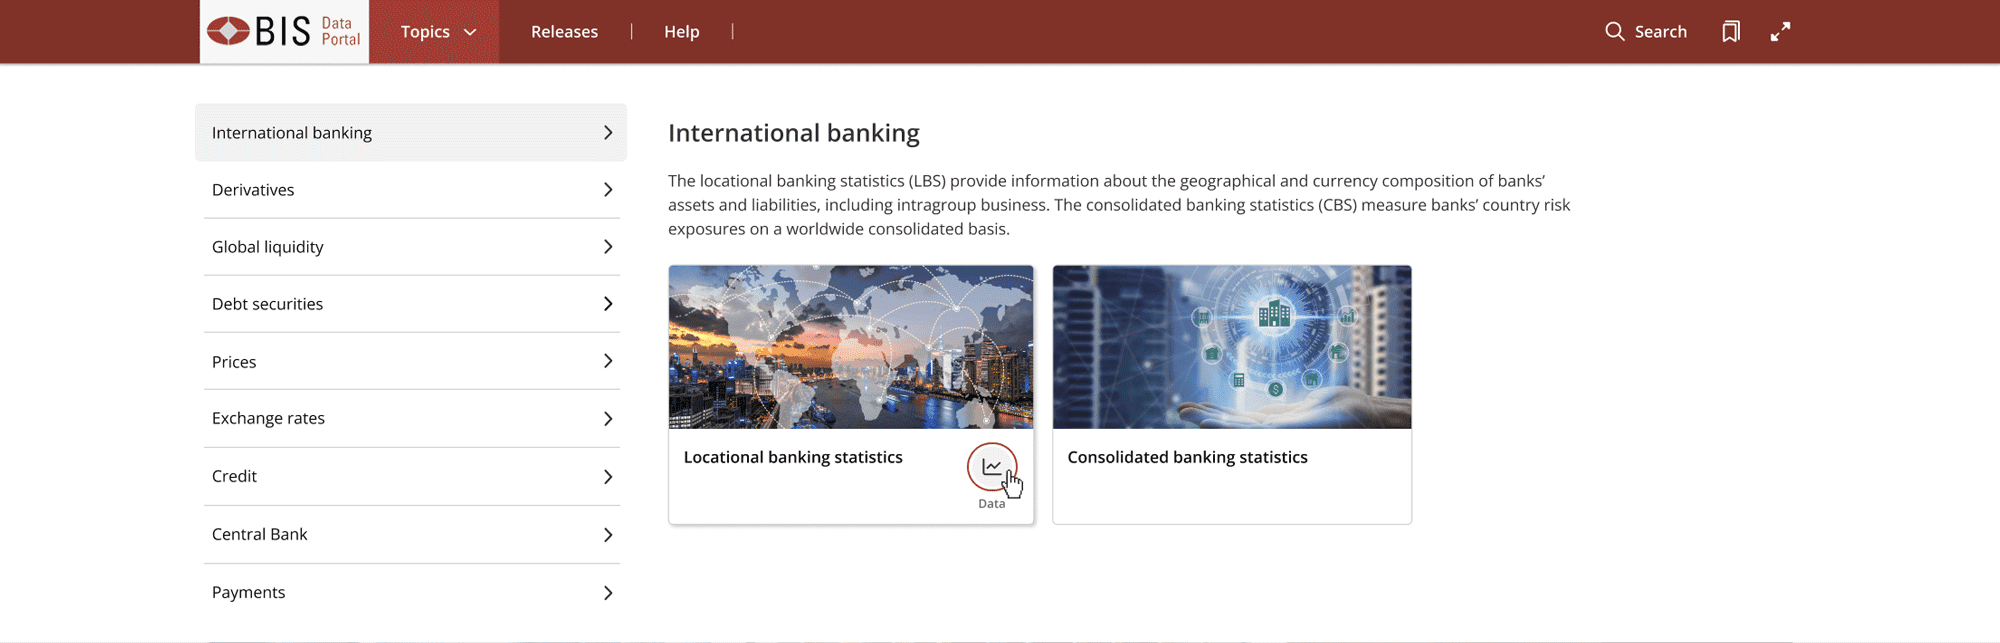
The BIS Data Portal offers various tools to guide you in exploring our statistics:
- Browse by topic to learn more about the available data sets and relevant methodology, to gain data insights from the statistical tables and dashboards prepared by BIS statisticians and to directly access and query the data and metadata.
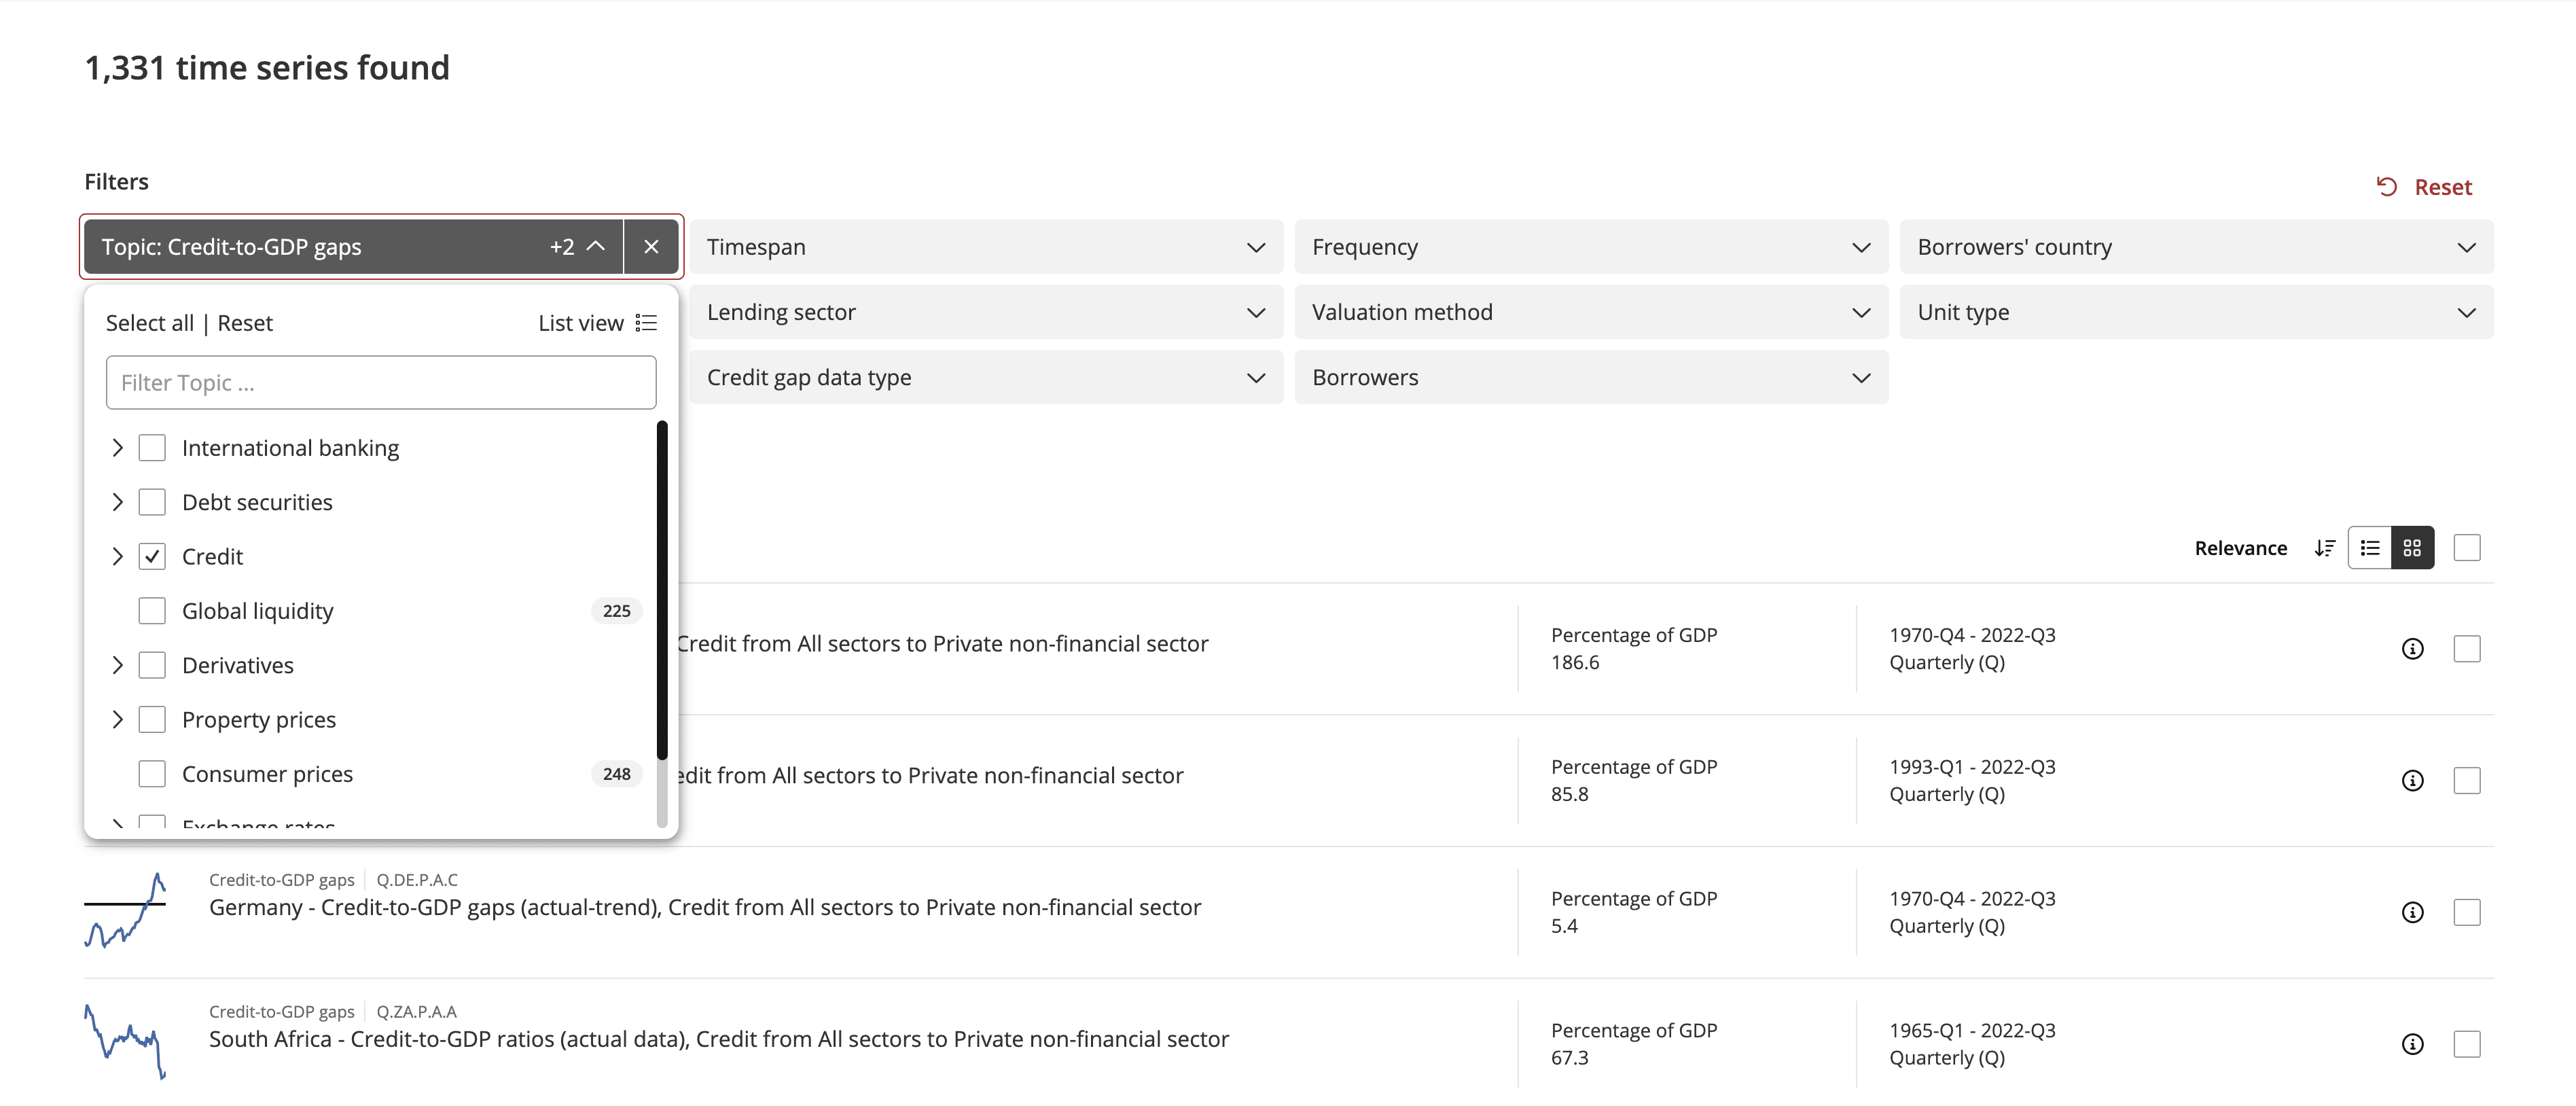
- Search for time series across all topics through the search bar and narrow down your search results, applying relevant filters.
- Explore data sets by country, topic and key characteristics.
Browse
Search

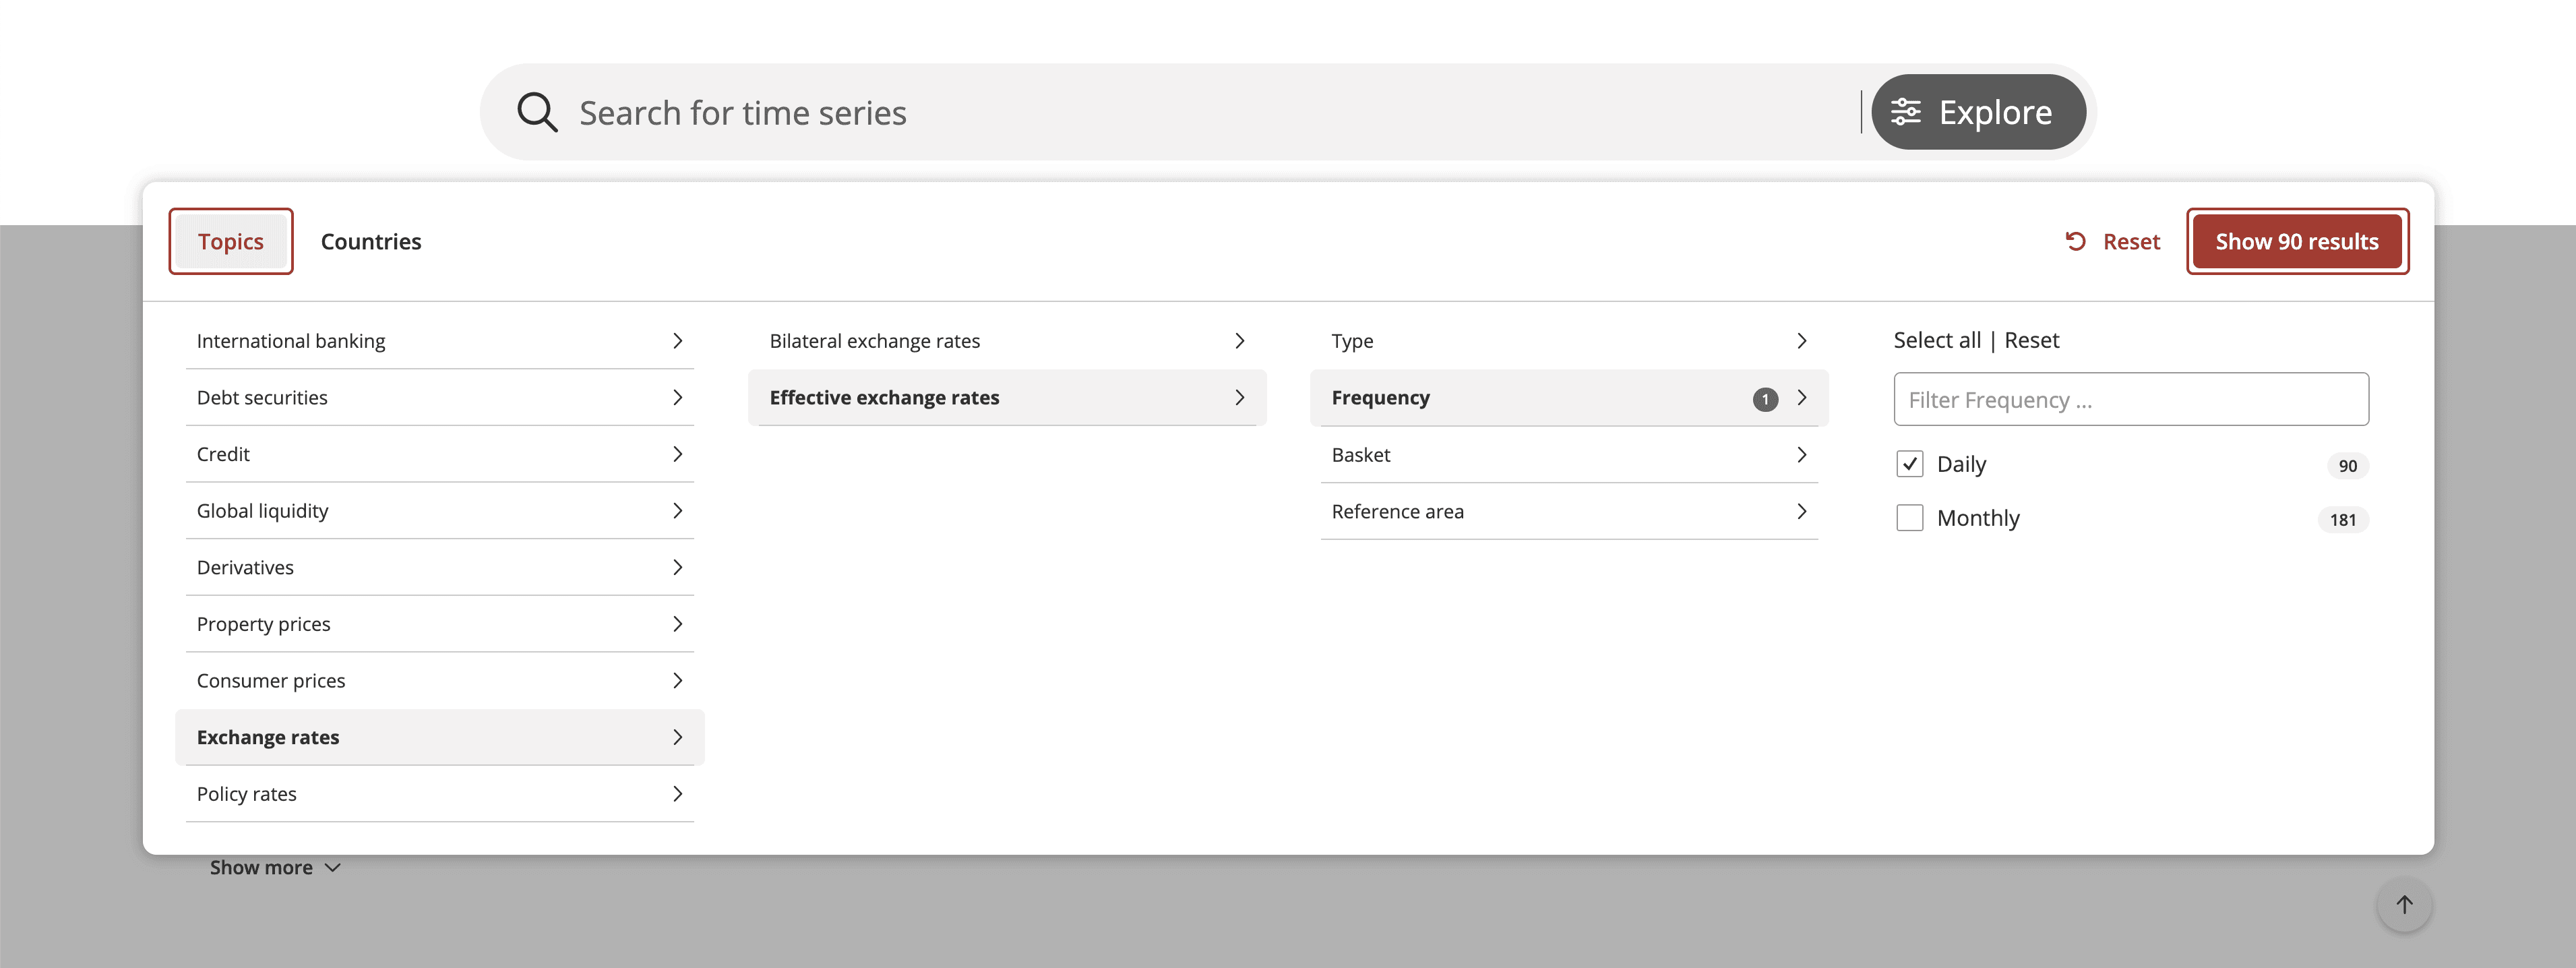
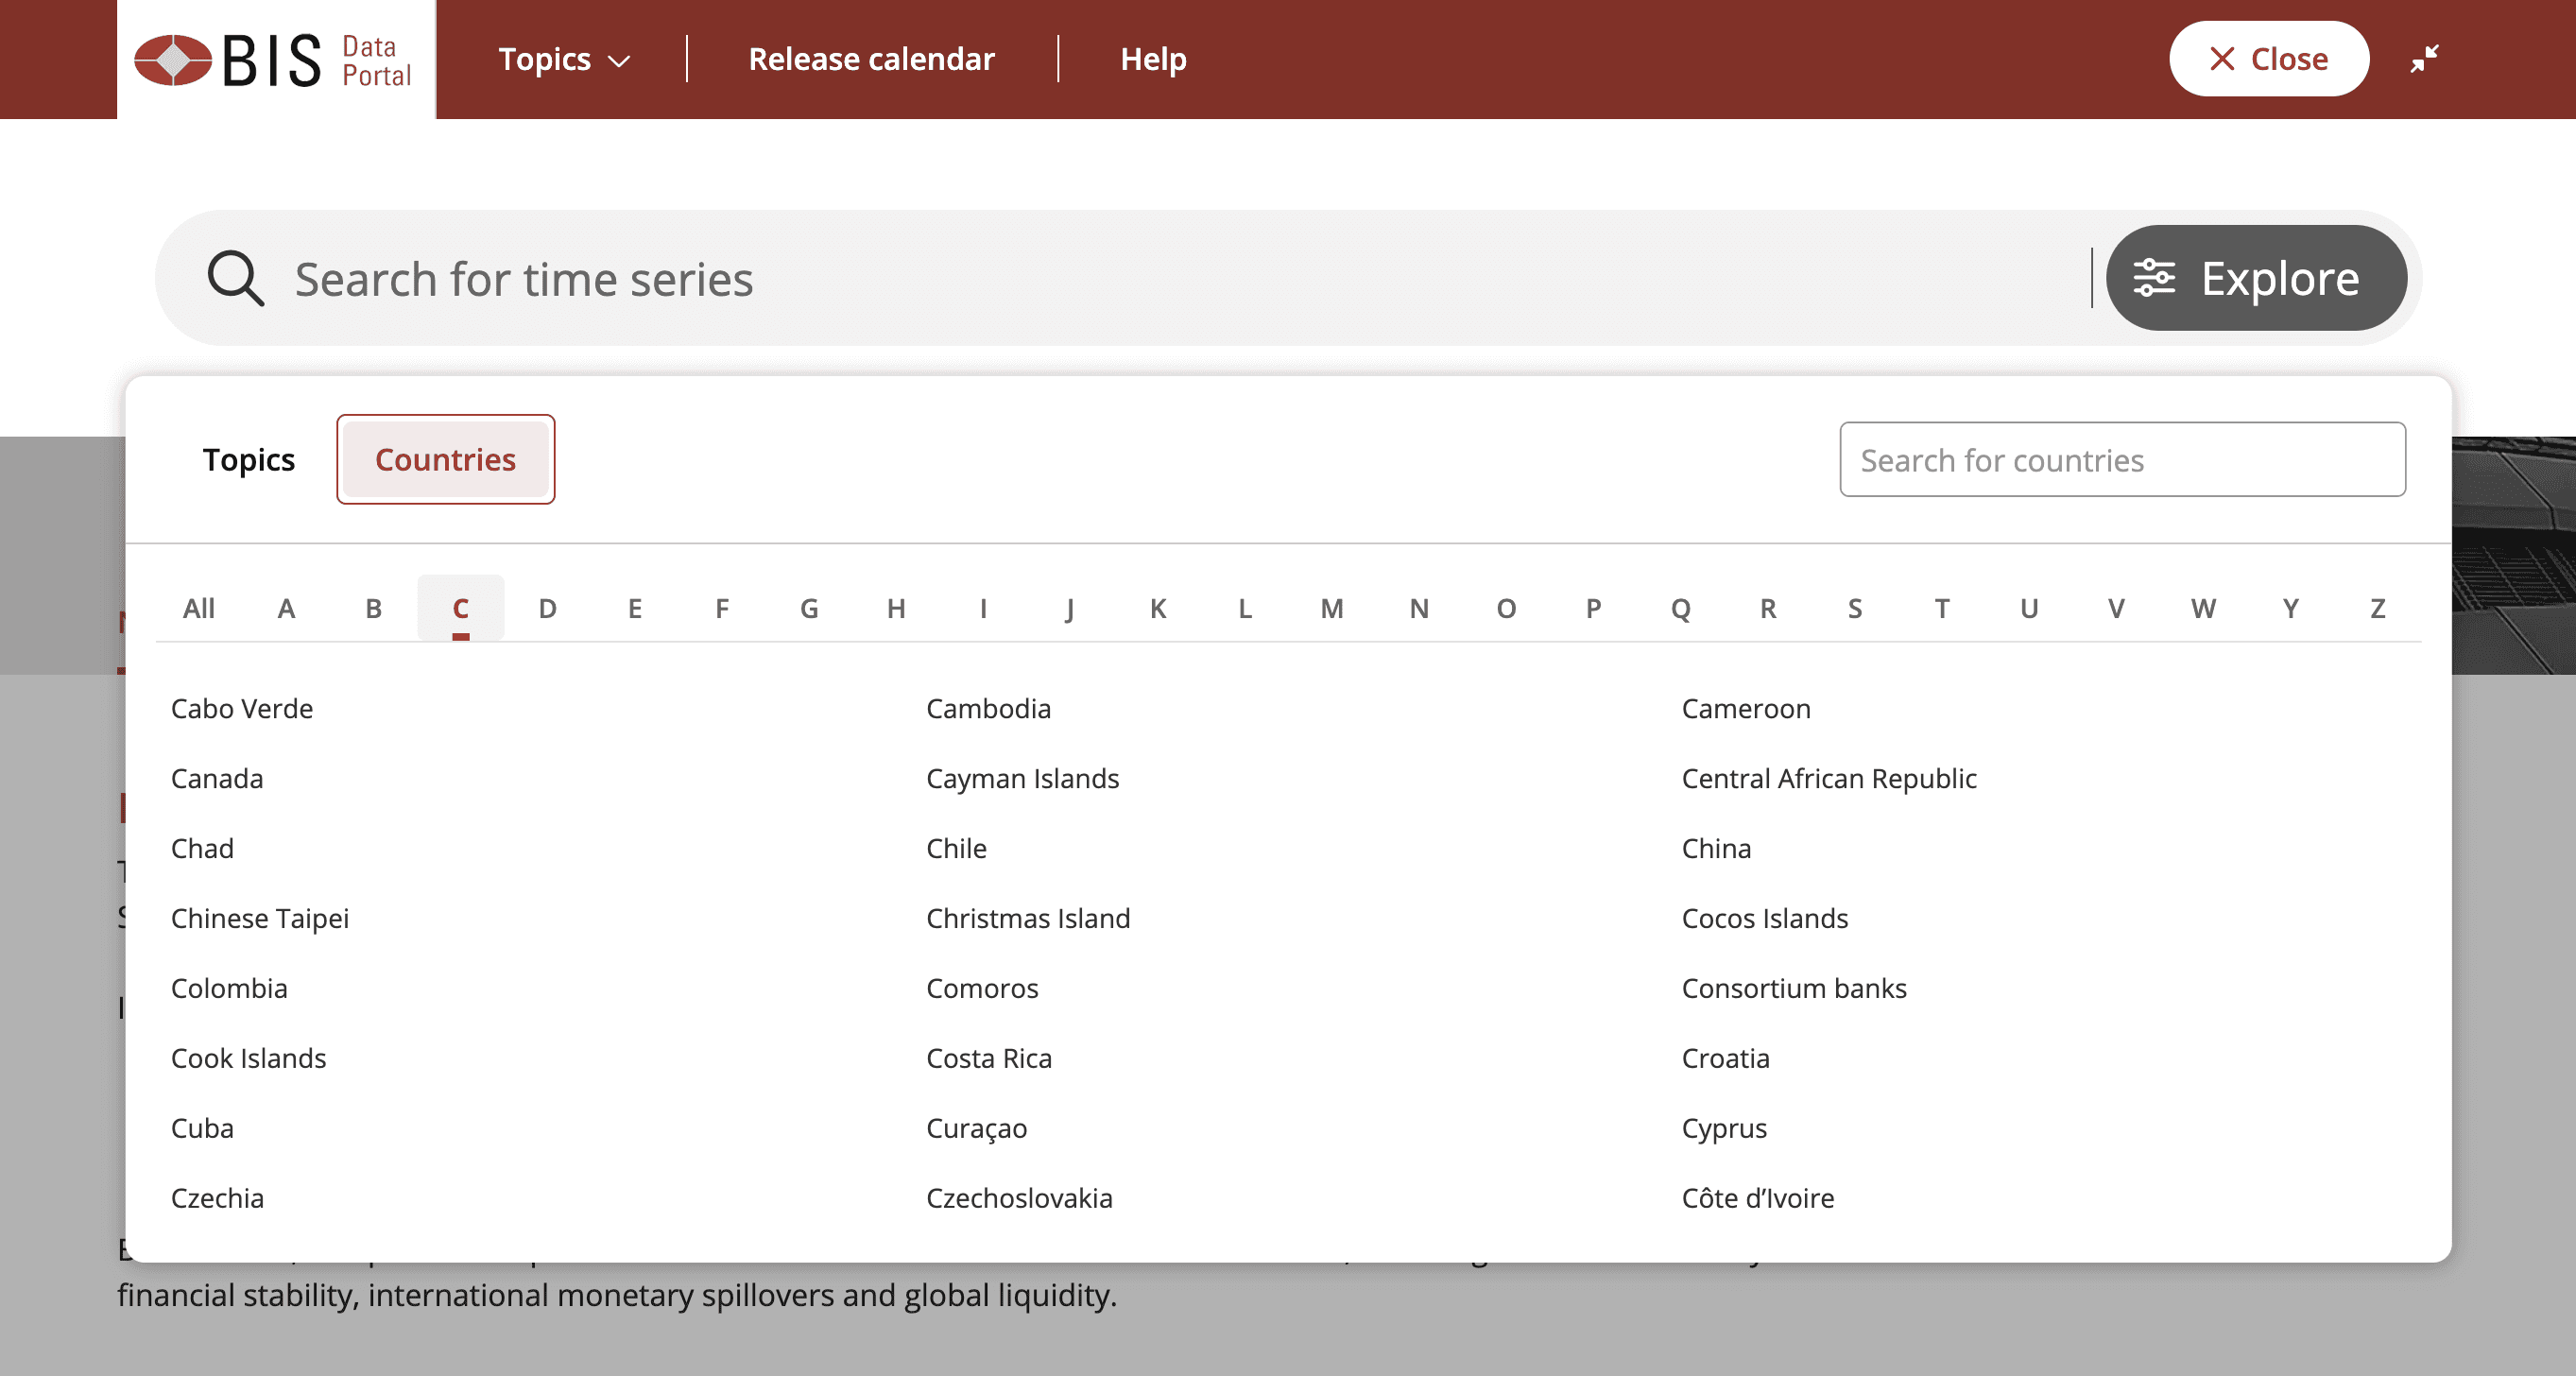
Explore
The button next to the search bar lets you explore BIS statistics by guiding you through the main characteristics of each data set.
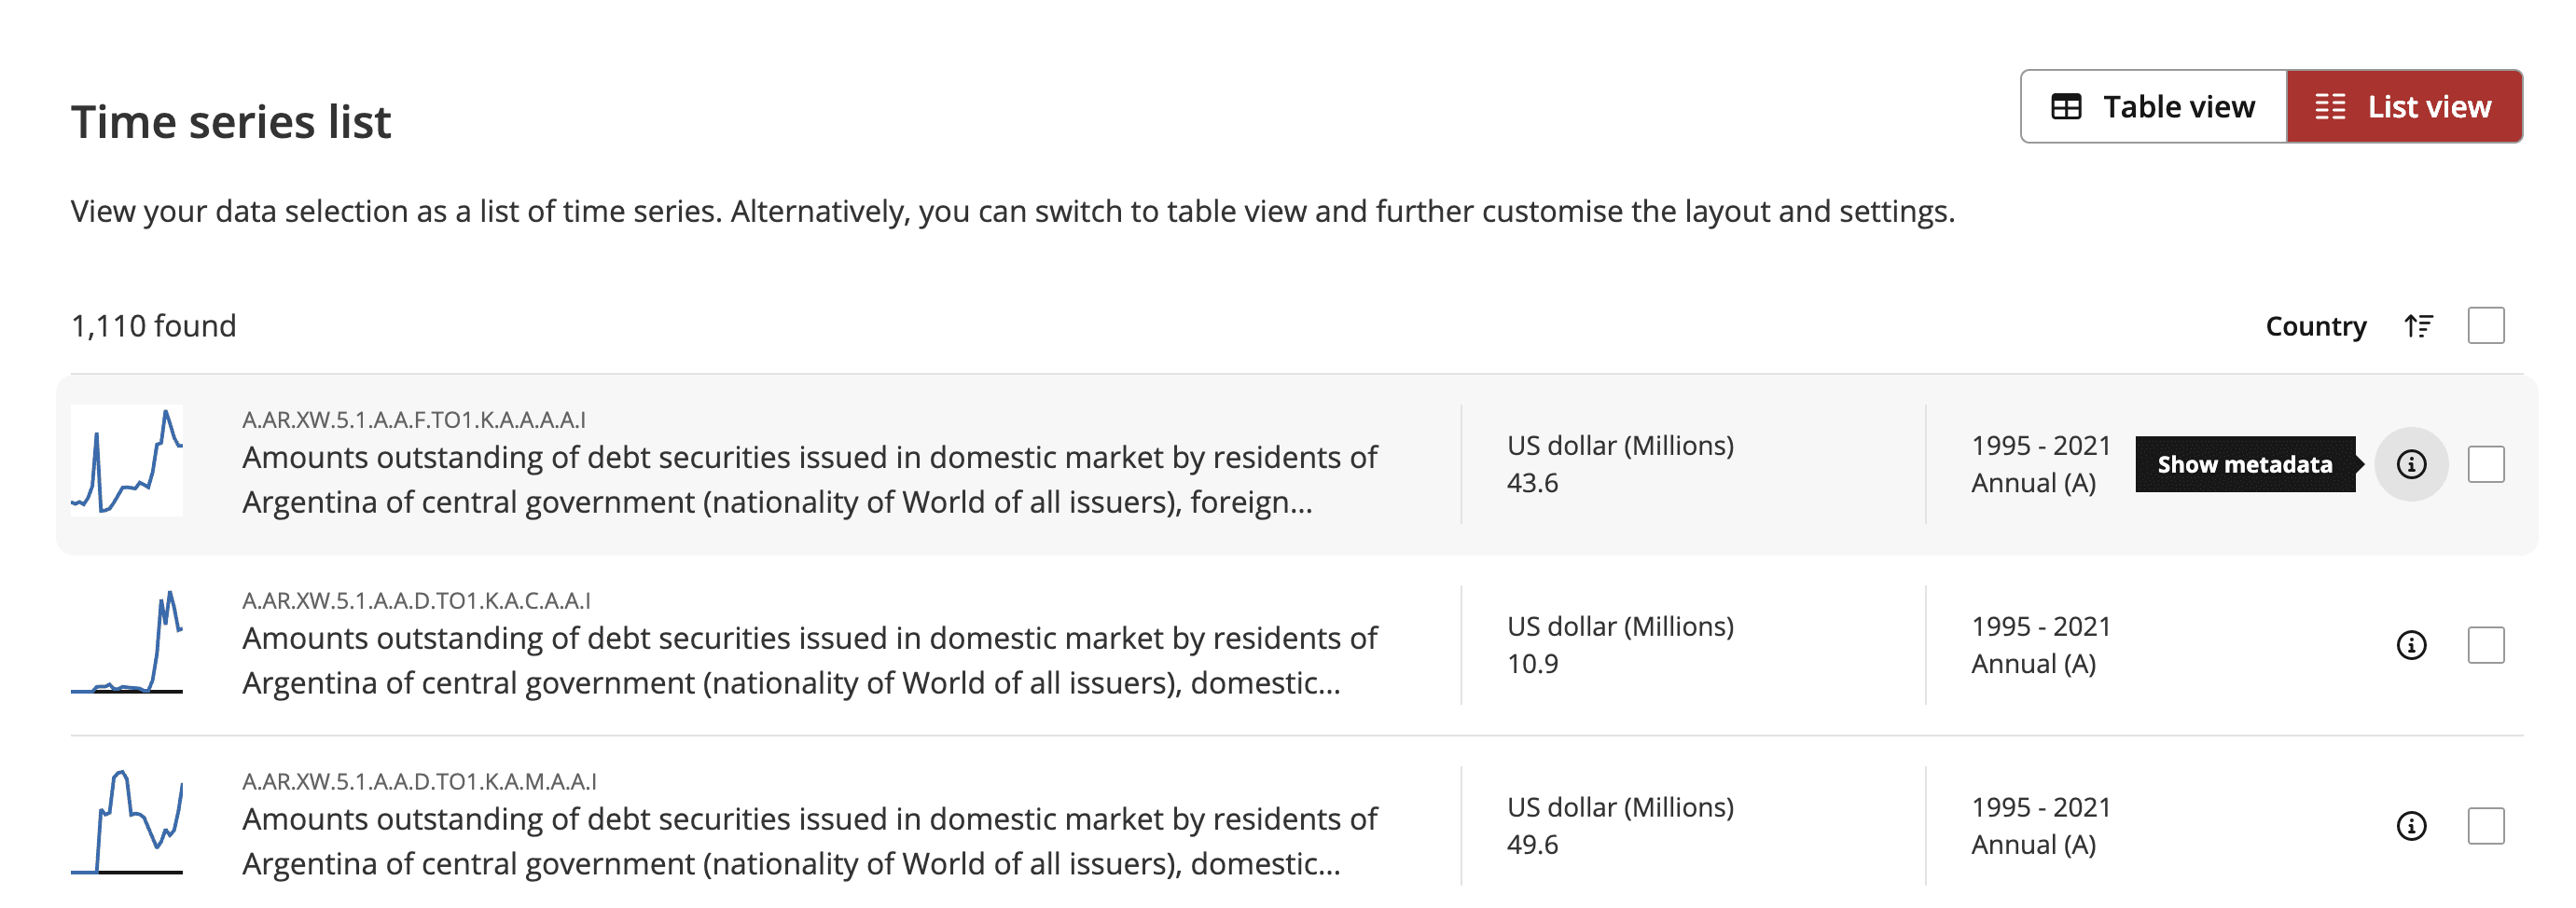
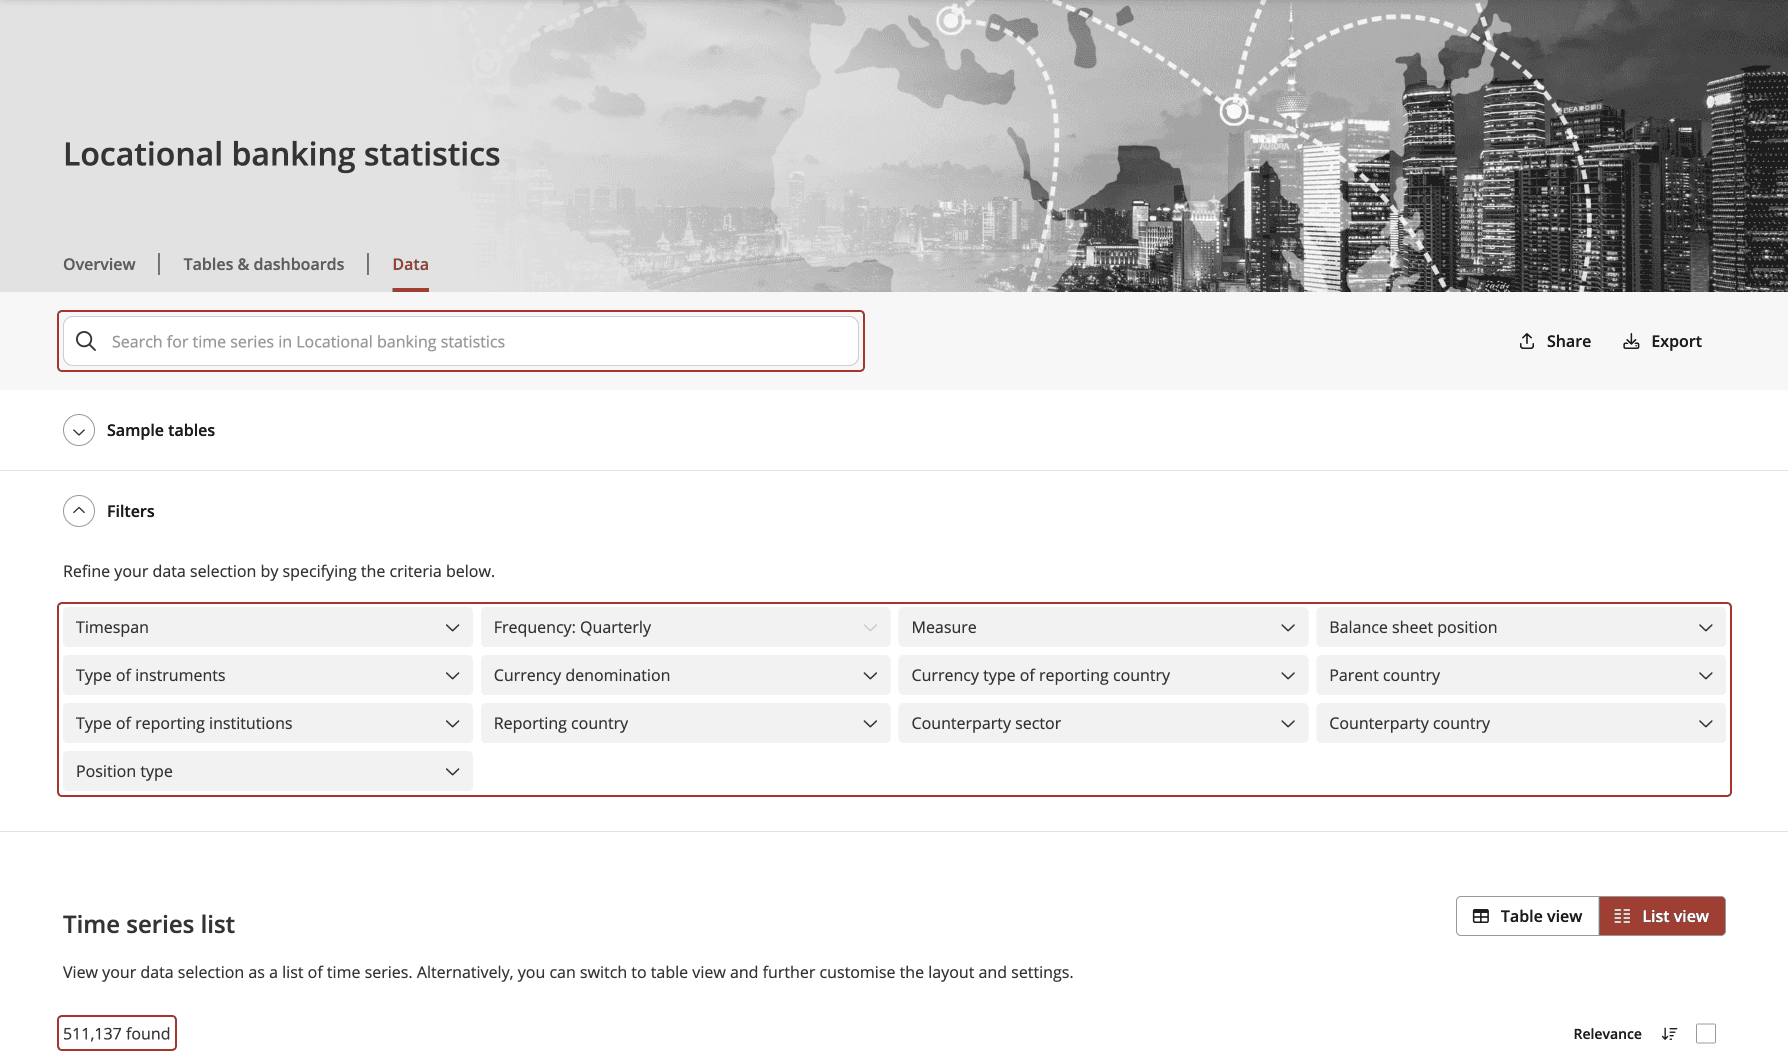
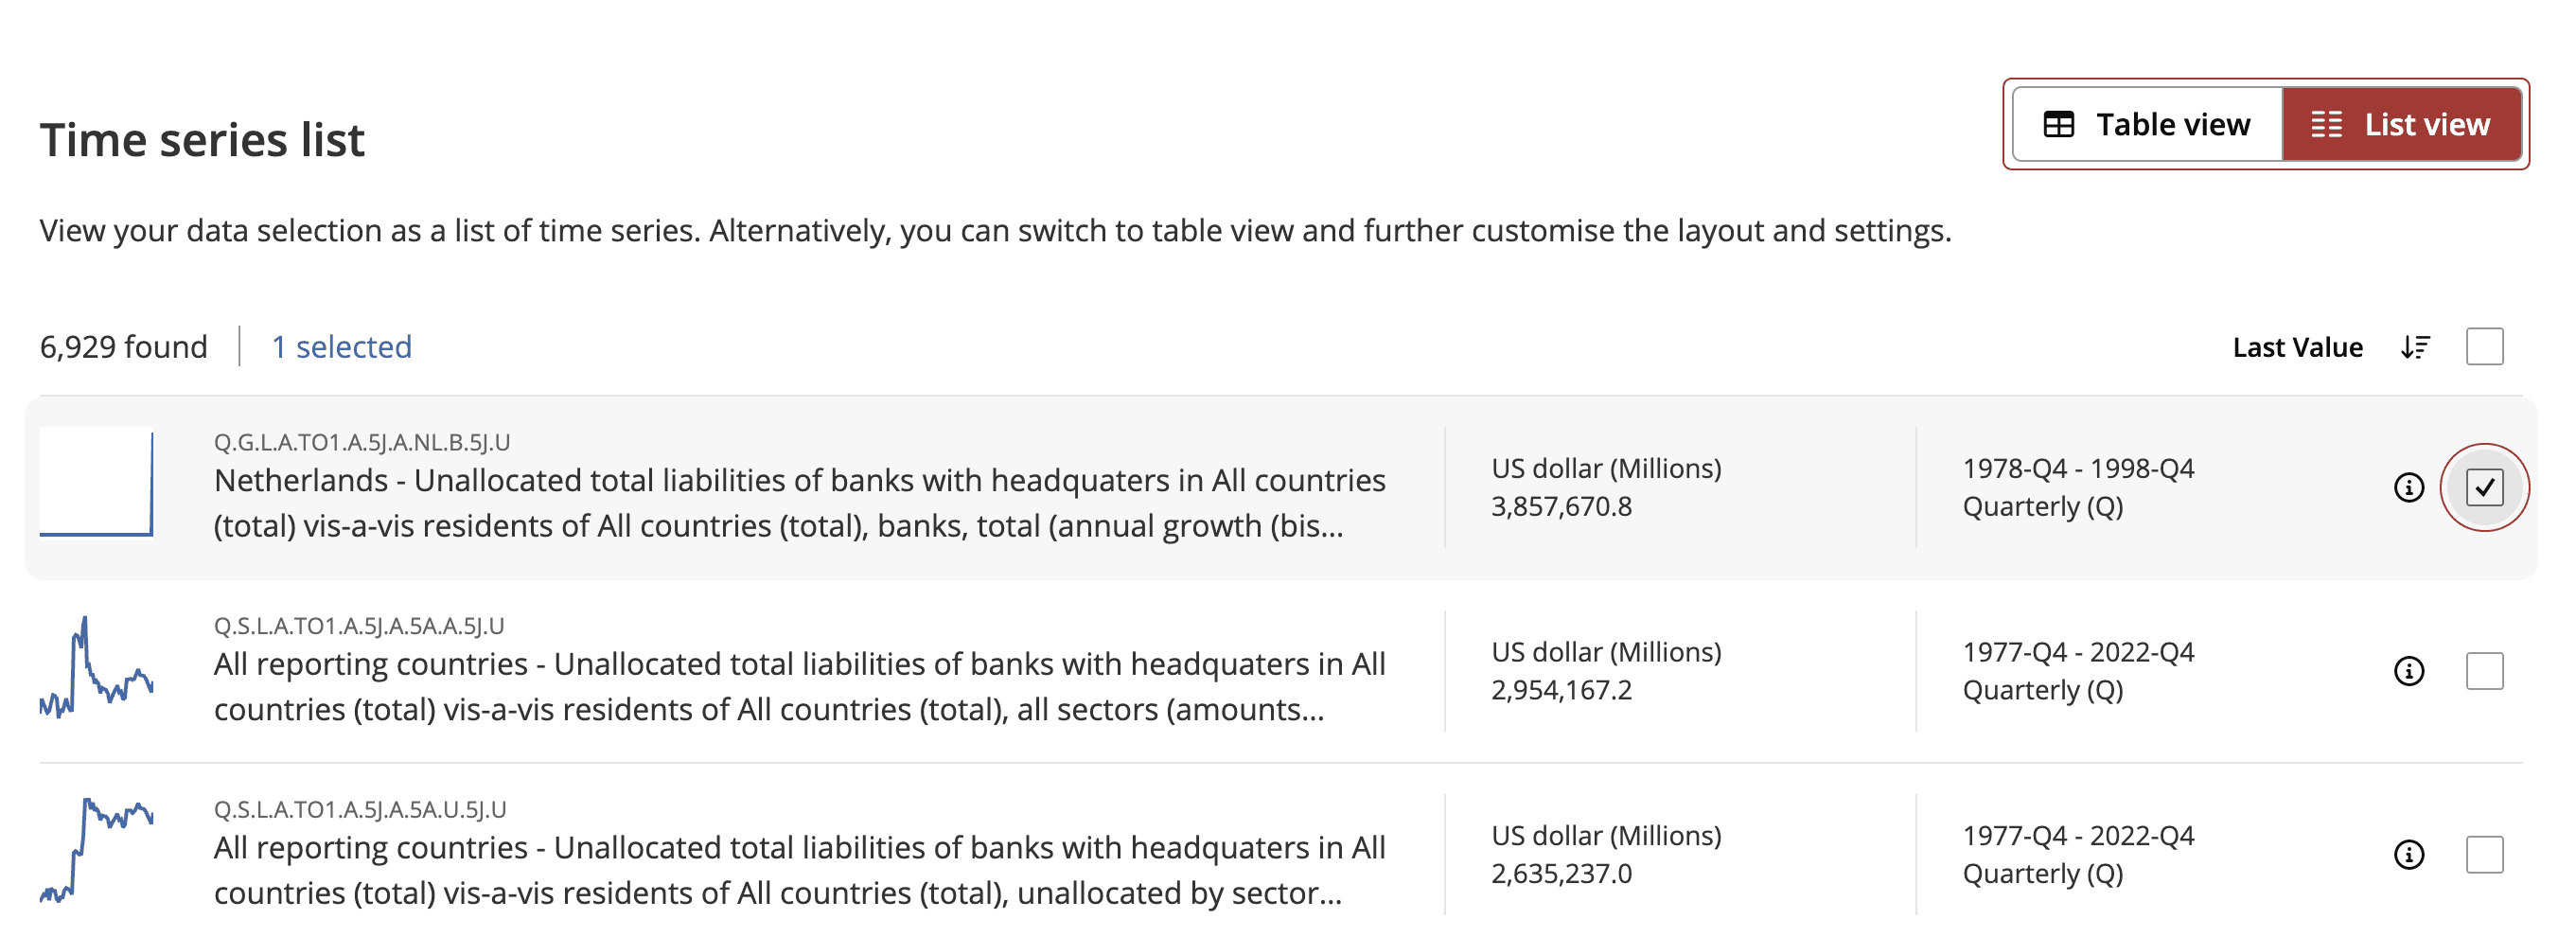
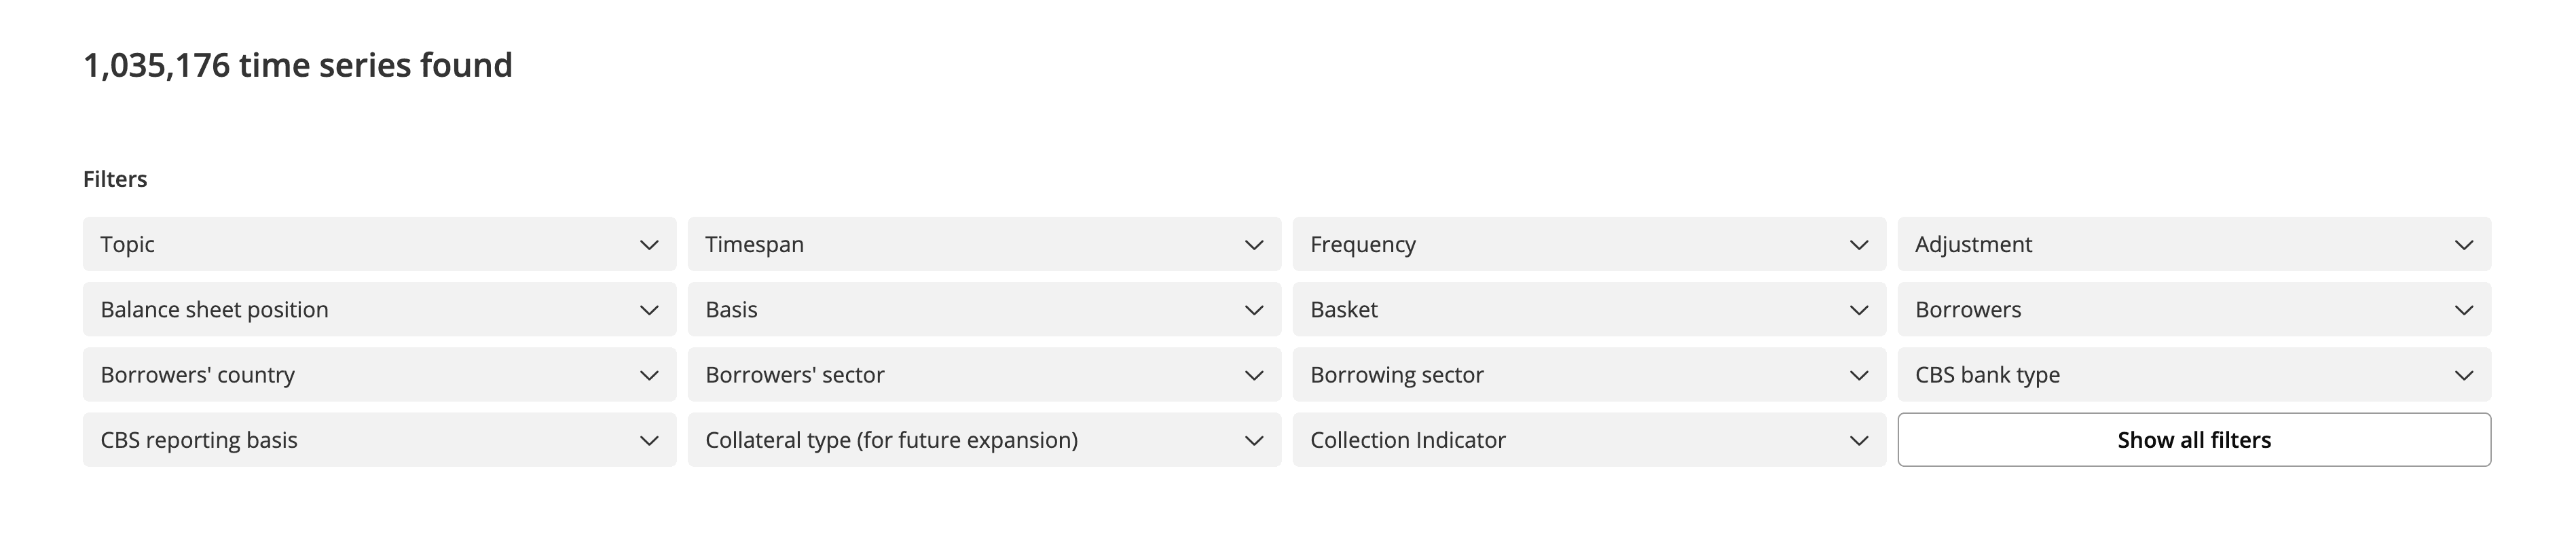
Results
After searching through the bar or using the explore functionality, the number of results will appear on the left side above the list of results.
Create your custom chart
You can also explore BIS statistics visually by building your own custom interactive chart.
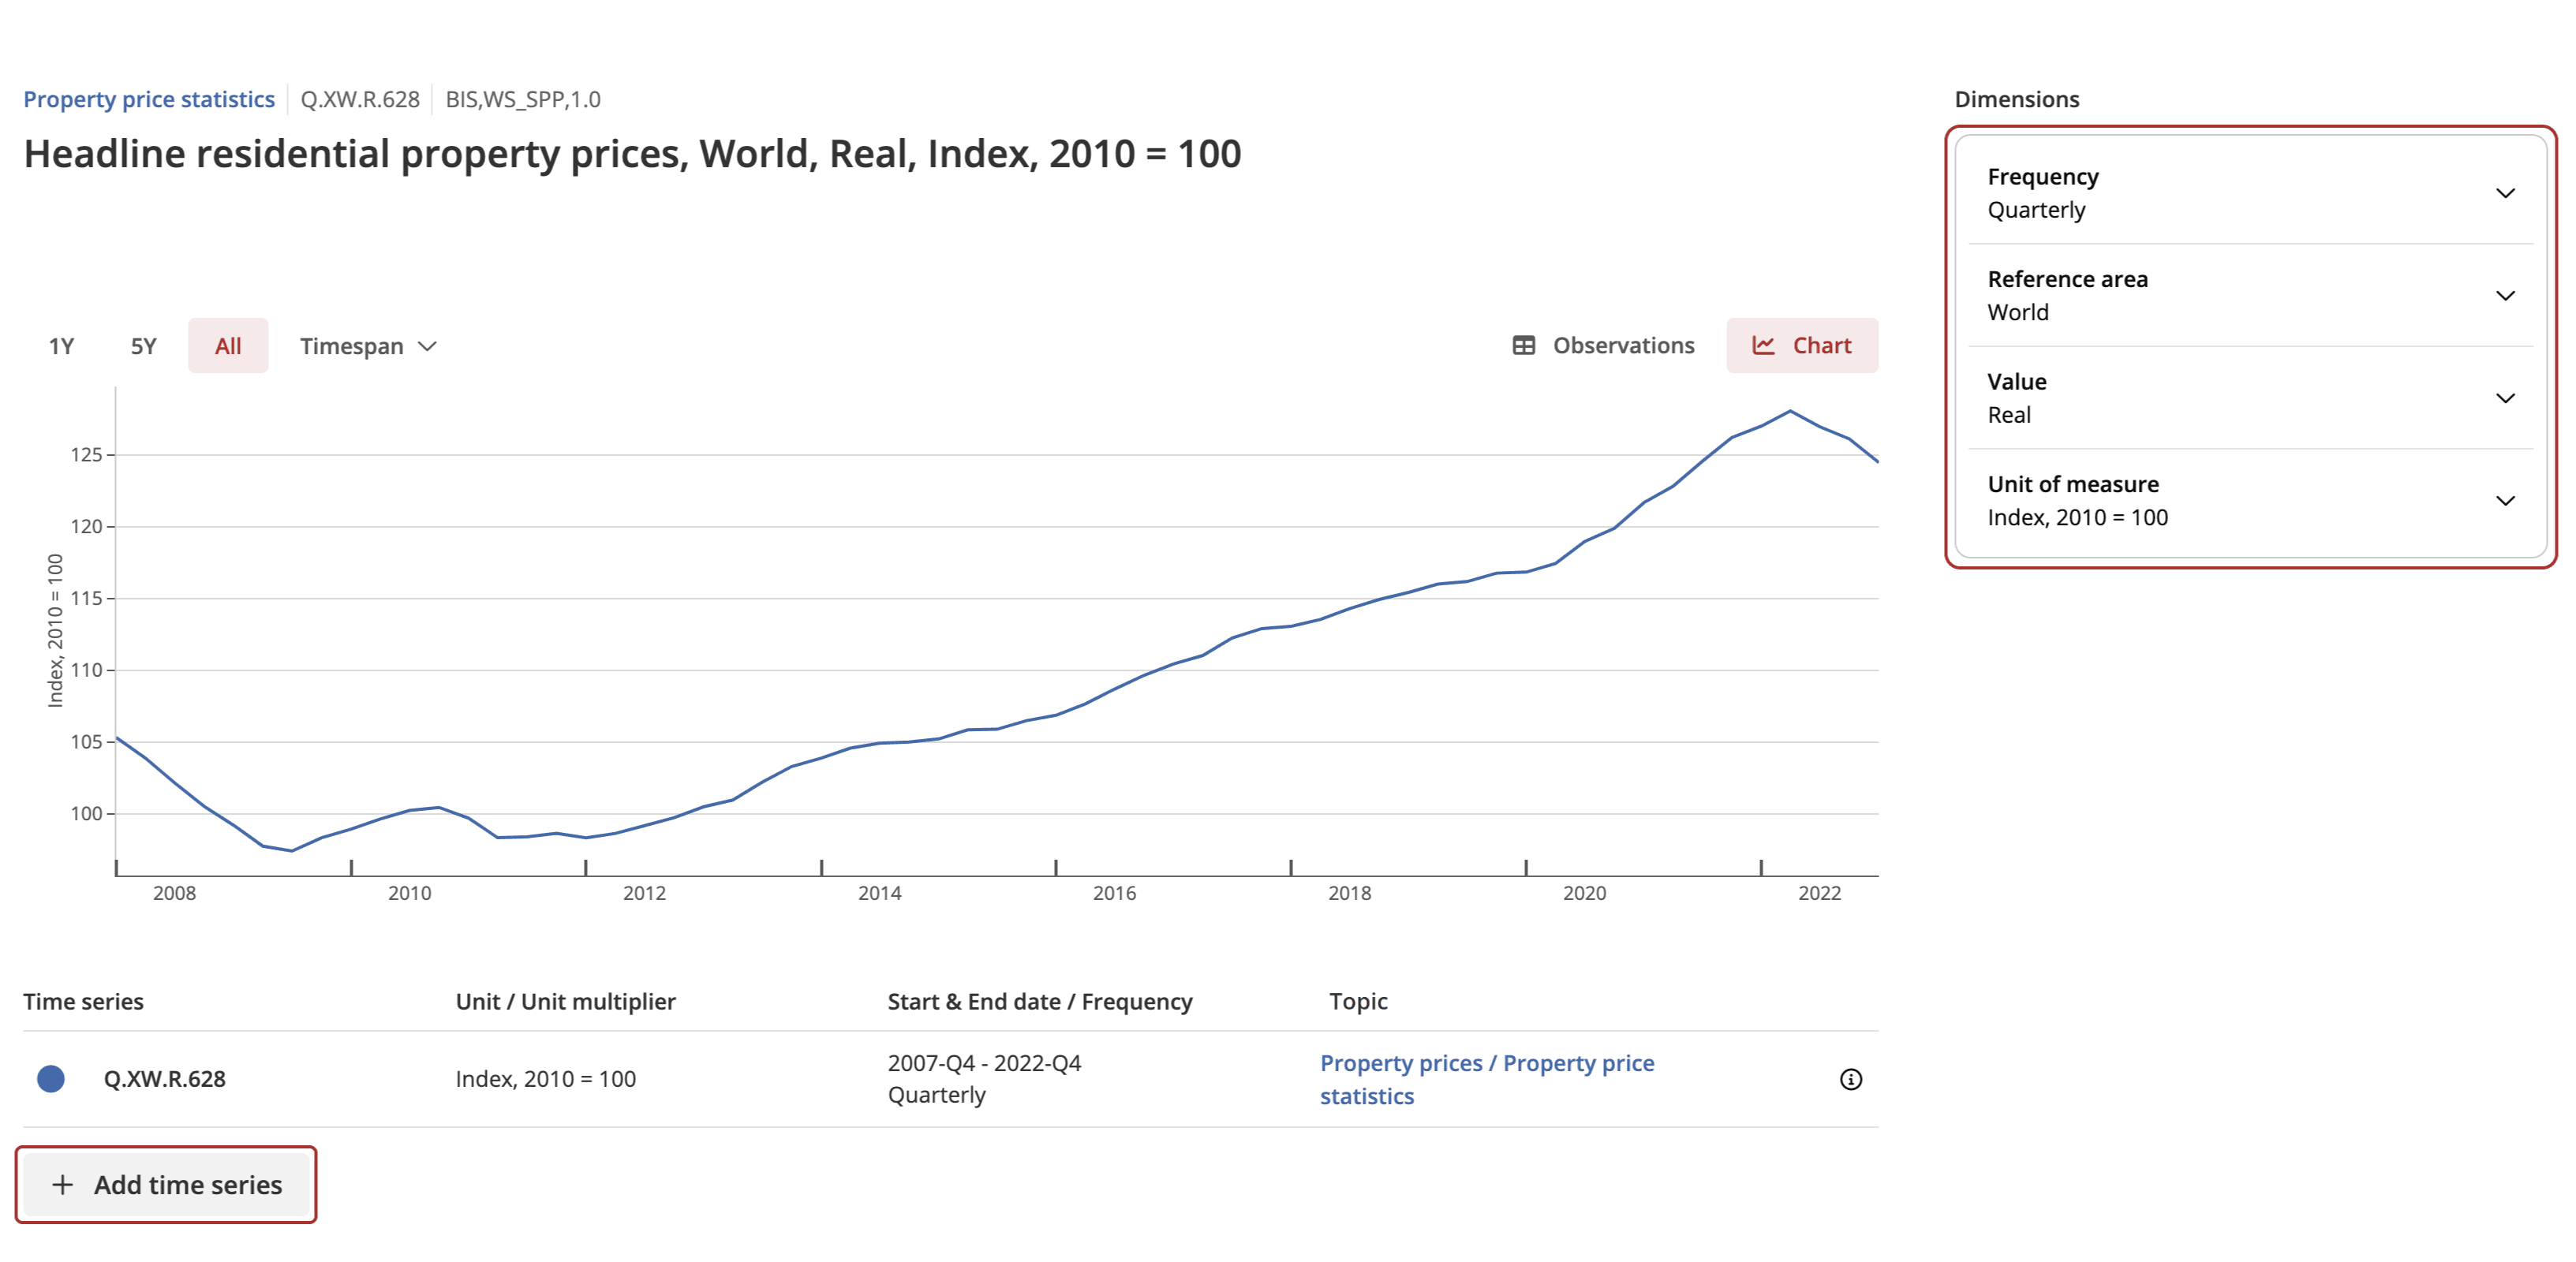
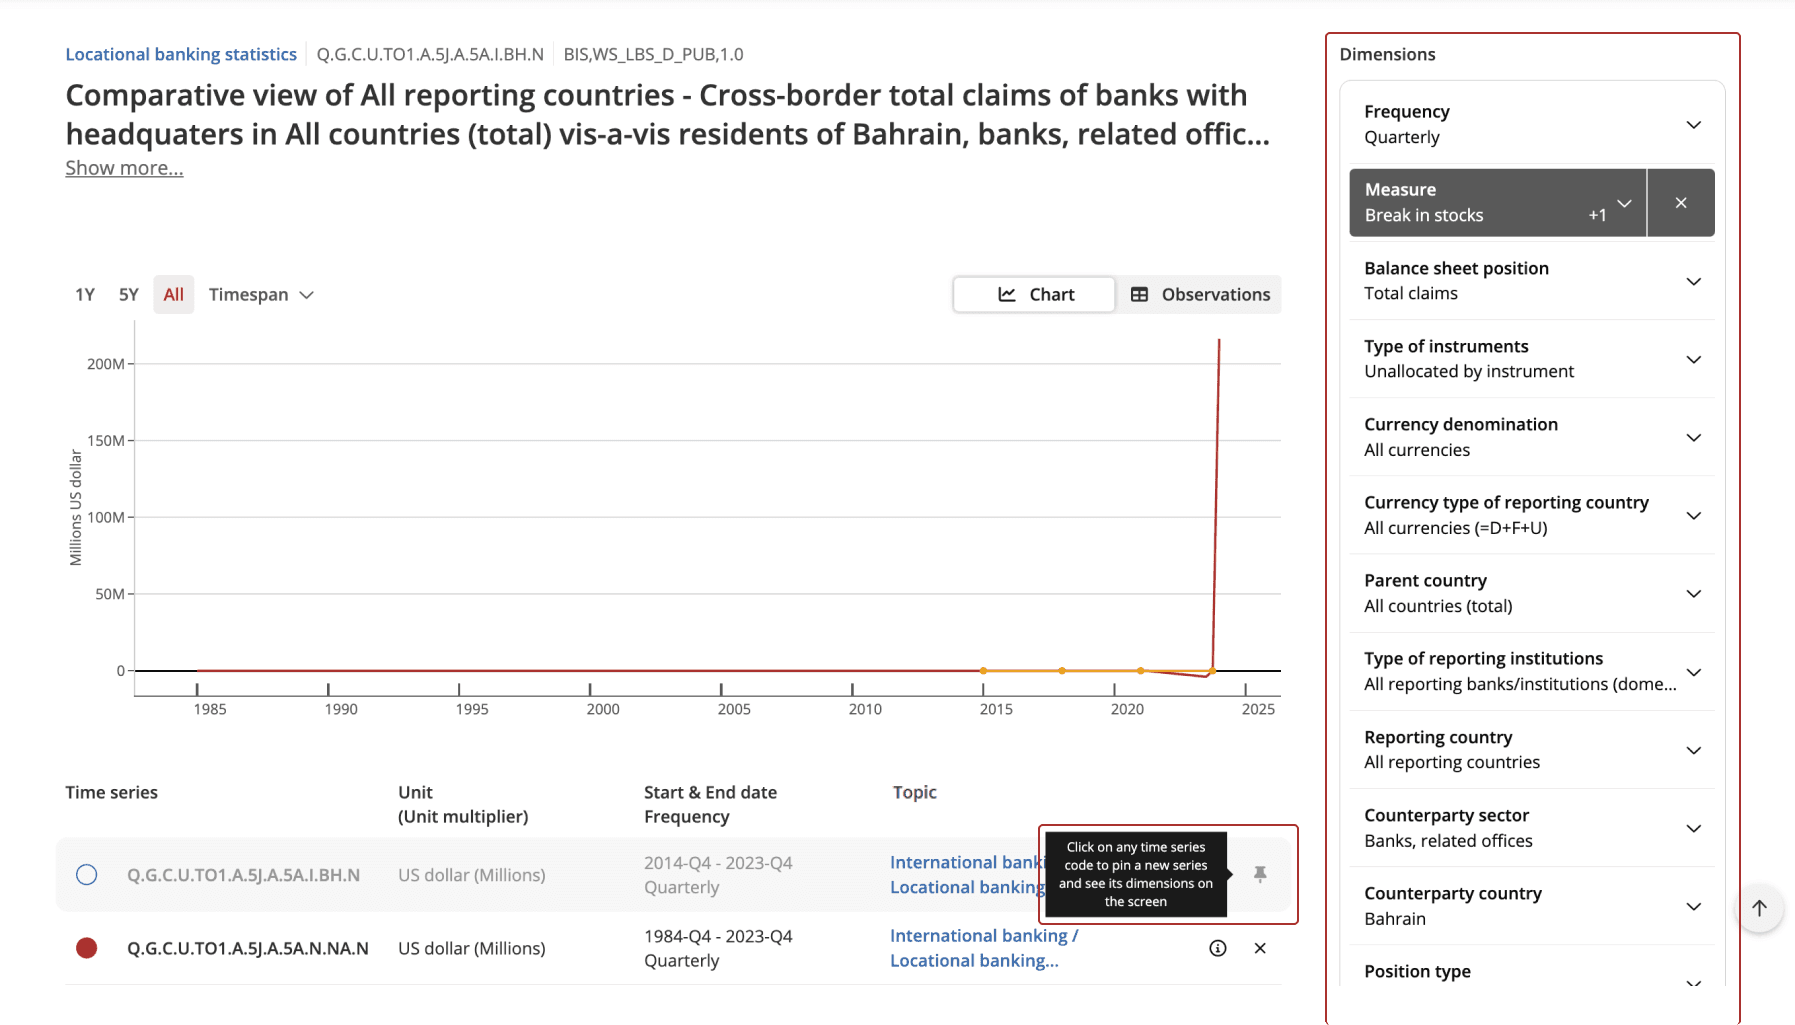
After you have successfully found your time series, click one of the results to go to a Chart view. You can add related time series belonging to the same data set by selecting any of the dimensions on the right-hand side.
Alternatively, add a time series from any other data set by clicking on the Add time series button below the interactive chart.
If multiple time series are plotted, the top series in the list is pinned by default. The dimensions of the pinned series are displayed in the box on the right. To pin a different series, click on its code on the left. The dimensions of the newly pinned series will then be displayed in the box on the right.
To toggle the visibility of breaks in a time series, click on the 'B' icon. If no break is available, the icon will not appear.
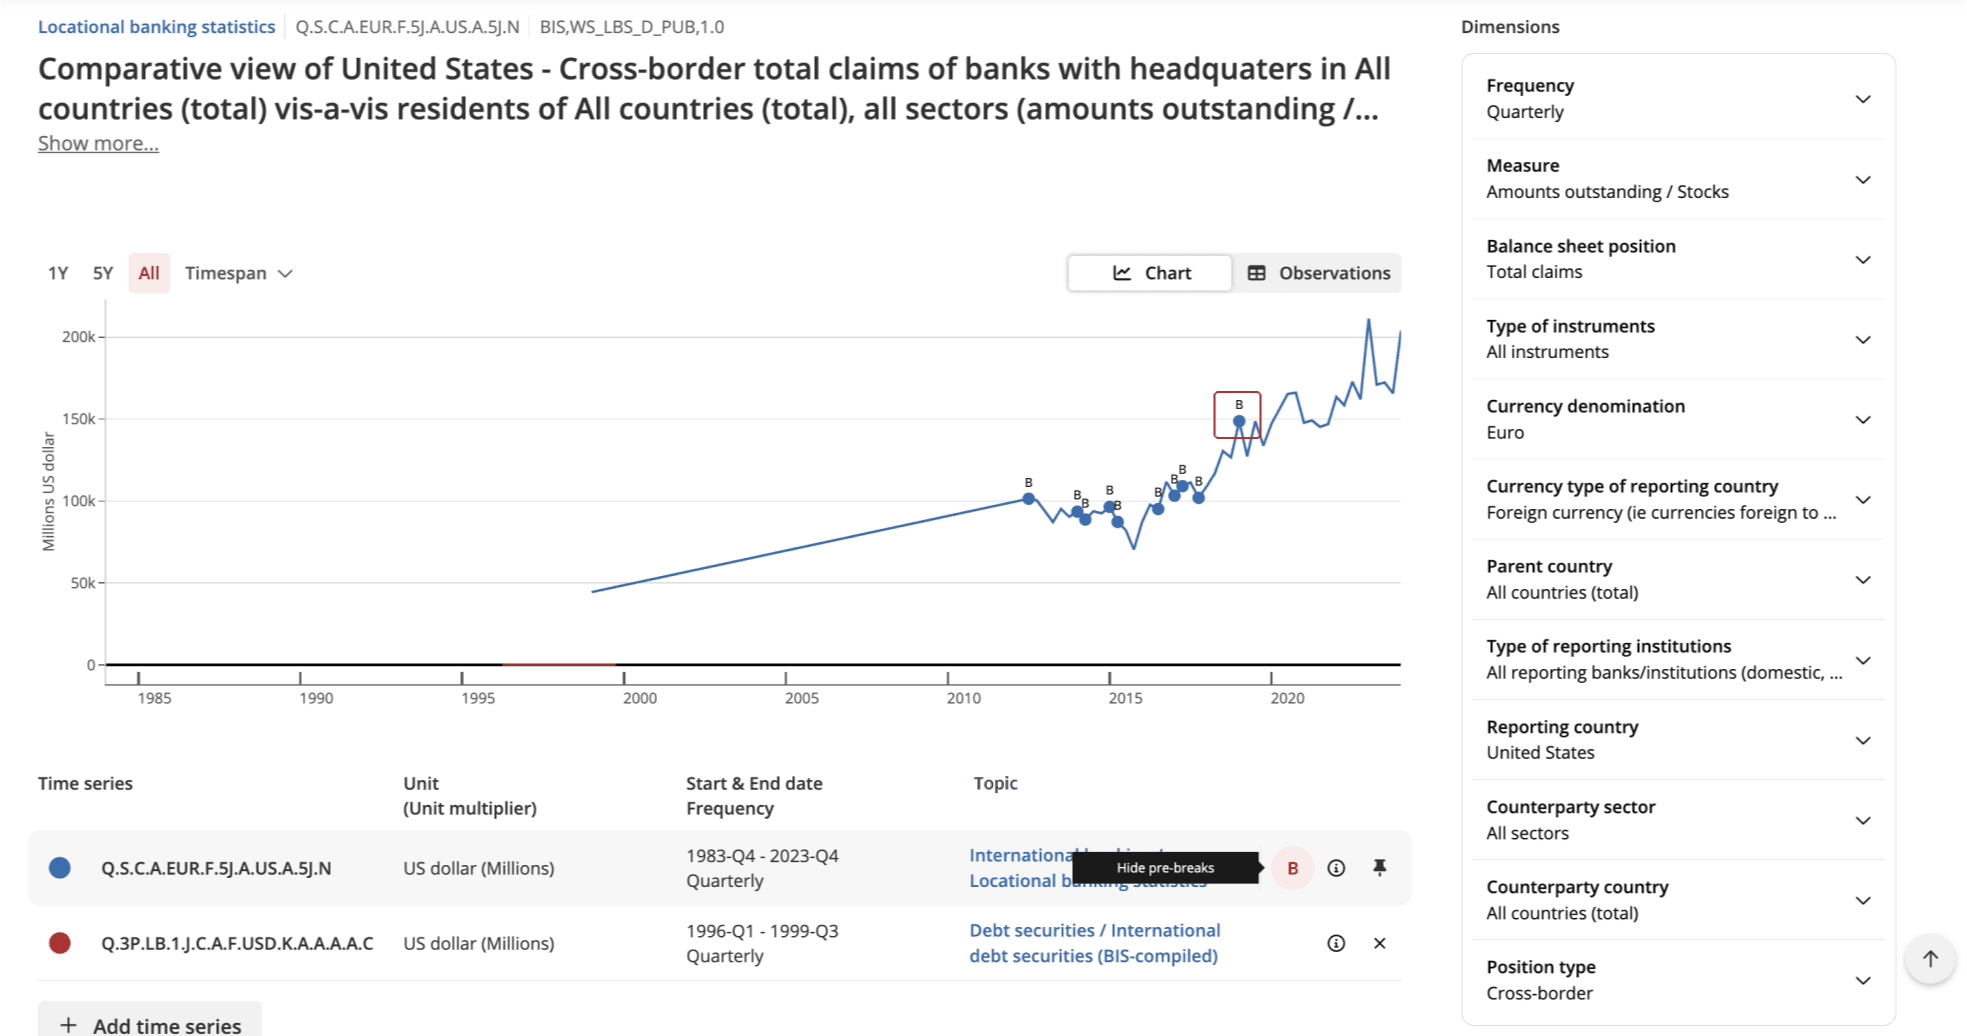
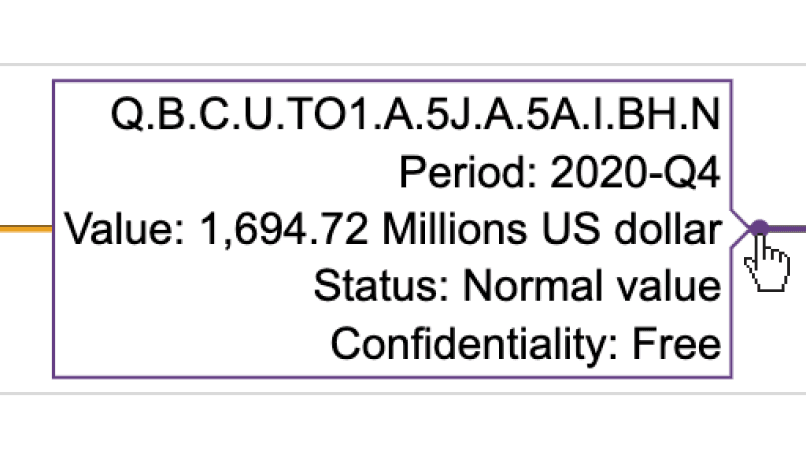
Hover over the break icon in the plot to see additional information, such as the pre-break value.
Tables
The BIS Data Portal offers two types of tables: Publication tables and Custom tables.
- Publication tables offer a predefined, ready-to-use view of the data. Navigate to the Tables & Dashboards page of your topic to find any available publication table. These tables can be visualized directly on the BIS Data Portal or downloaded as PDF files. Some topics do not offer Publication tables.
- Custom tables: unlike publication tables, the view of the data can be customised with filters or layout options.
- Navigate to the Data section of the topic. Use the search bar or available filters to find the time series you want to include in your table.
- Once you have selected the relevant data series, you can create your table by clicking on the Table view. You can customize the layout by clicking on the Table settings icon, dragging and dropping respective dimensions to the columns or rows.
- You can share and export your Custom table, along with the custom settings, by clicking on the Share and Export buttons.
Dashboards
To gain quick insights about BIS statistics, you can explore our interactive dashboards. Navigate to the Tables & Dashboards page of the topic to find the available dashboards. Some topics do not offer Dashboards.
Find the metadata
To learn more about our statistics, select your topic from the Topics section to access its dedicated page. The Overview, Tables & dashboards and Data tabs allow you to easily navigate throughout all the aspects of a topic.